Menieres Monitor 2017
What is new for 2017?
Thanks to some further funding in 2016 we've been able to enhance the features of the Meniere's Monitor.
We have worked on updating the user results section. So now when you login to your data you'll be able to:
- Print report summaries
- Print graphics
- Look in more detail at what might excerbate your symptoms
The new features are discussed in more detail below.
Report summaries
Select the date range of interest using the start and end dates.
You can look at up to a 12 month period.
The summary will tell you:
- Total number of attacks in the selected time period
- Attacks by month
- Information about each individual attack
The summary will also provide average monthly scores for your dizziness, tinnitus, aural fullness and hearing loss.
Test what might influence your symptoms
In the Summary section of your results there are a number of new features.
Firstly we use your data to see if there is a relationship between:
- Attacks and doing something unusual
- Attacks and stress levels
- Attacks and sleep duration
- Dizziness levels and doing something unusual
- Dizziness levels and stress
We selected these as we have seen interesting relationships in the overall data so we thought you might be interested to see what happens with your own data.
Plotting your own graphs
In the comparison section you are able to create your own bespoke plots as you were able to do before. However, we now give you a bit more information about potential relationships that might exist in the data. So you can now investigate whether any particular factors seem to influence your condition. For example, you might be interested to look at how salt influences your tinnitus. If you select salt and tinnitus it will plot you results and if you have at least 10 data points it will tell you whether the relationship is:
- Very strong
- Strong
- Medium
- Weak
- Very weak
How to interpret the results?
Correlations can be positive or negative:
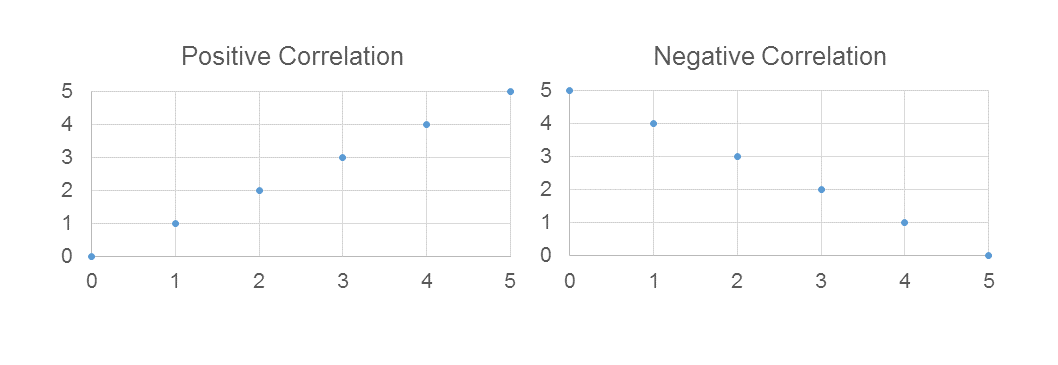
If they are positive it means as one factor (e.g. salt) increases so does the other factor (e.g. tinnitus). If they are negative it means that as one factor increases the other decreases. The strength of the correlation tells you how well they are related - strong or very strong correlations are suggestive of a relationship between the two factors.